International collaboration for reducing alcohol intake among LGBTQ+ women
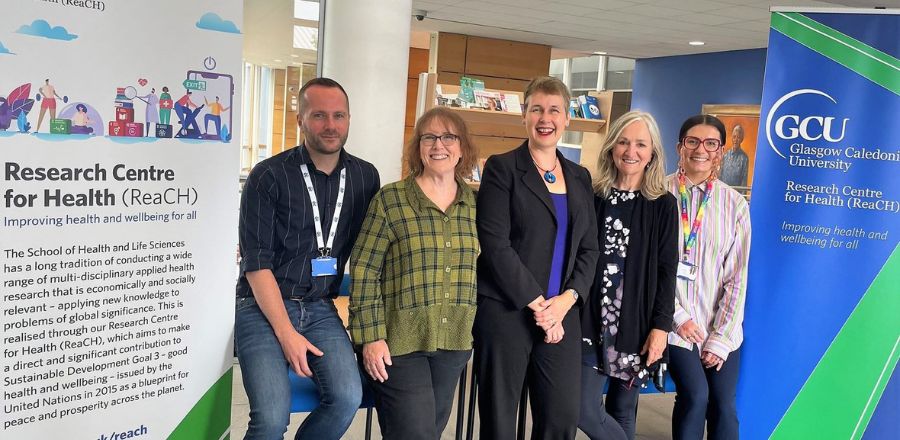
Photo shows Drs. David Whiteley, Laurie Drabble, Carol Emslie, Tonda Hughes, and Beth Meadows together at Glasgow Caledonian University’s Research Centre for Health.
Dr. Tonda Hughes and CHLEW collaborators Drs. Lauren Bochicchio and Laurie Drabble are currently abroad working with researchers in Glasgow on a new research collaboration. The study aims to look at how sober curiosity, a movement centered around challenging social norms around drinking, might be useful for LGBTQ+ women.

Who are CHLEW participants today?
Since the CHLEW study began in 1999, our participants have changed in some ways and remained the same in others.
We began interviewing participants in 2000-2002, and since then our participant groups have changed in many ways and remained the same in others. Take a look at the interesting facts and figures below, gathered from all four completed rounds of interviews with a focus on the most recent in 2017-2019, to see who CHLEW participants are today!
Where CHLEW participants live
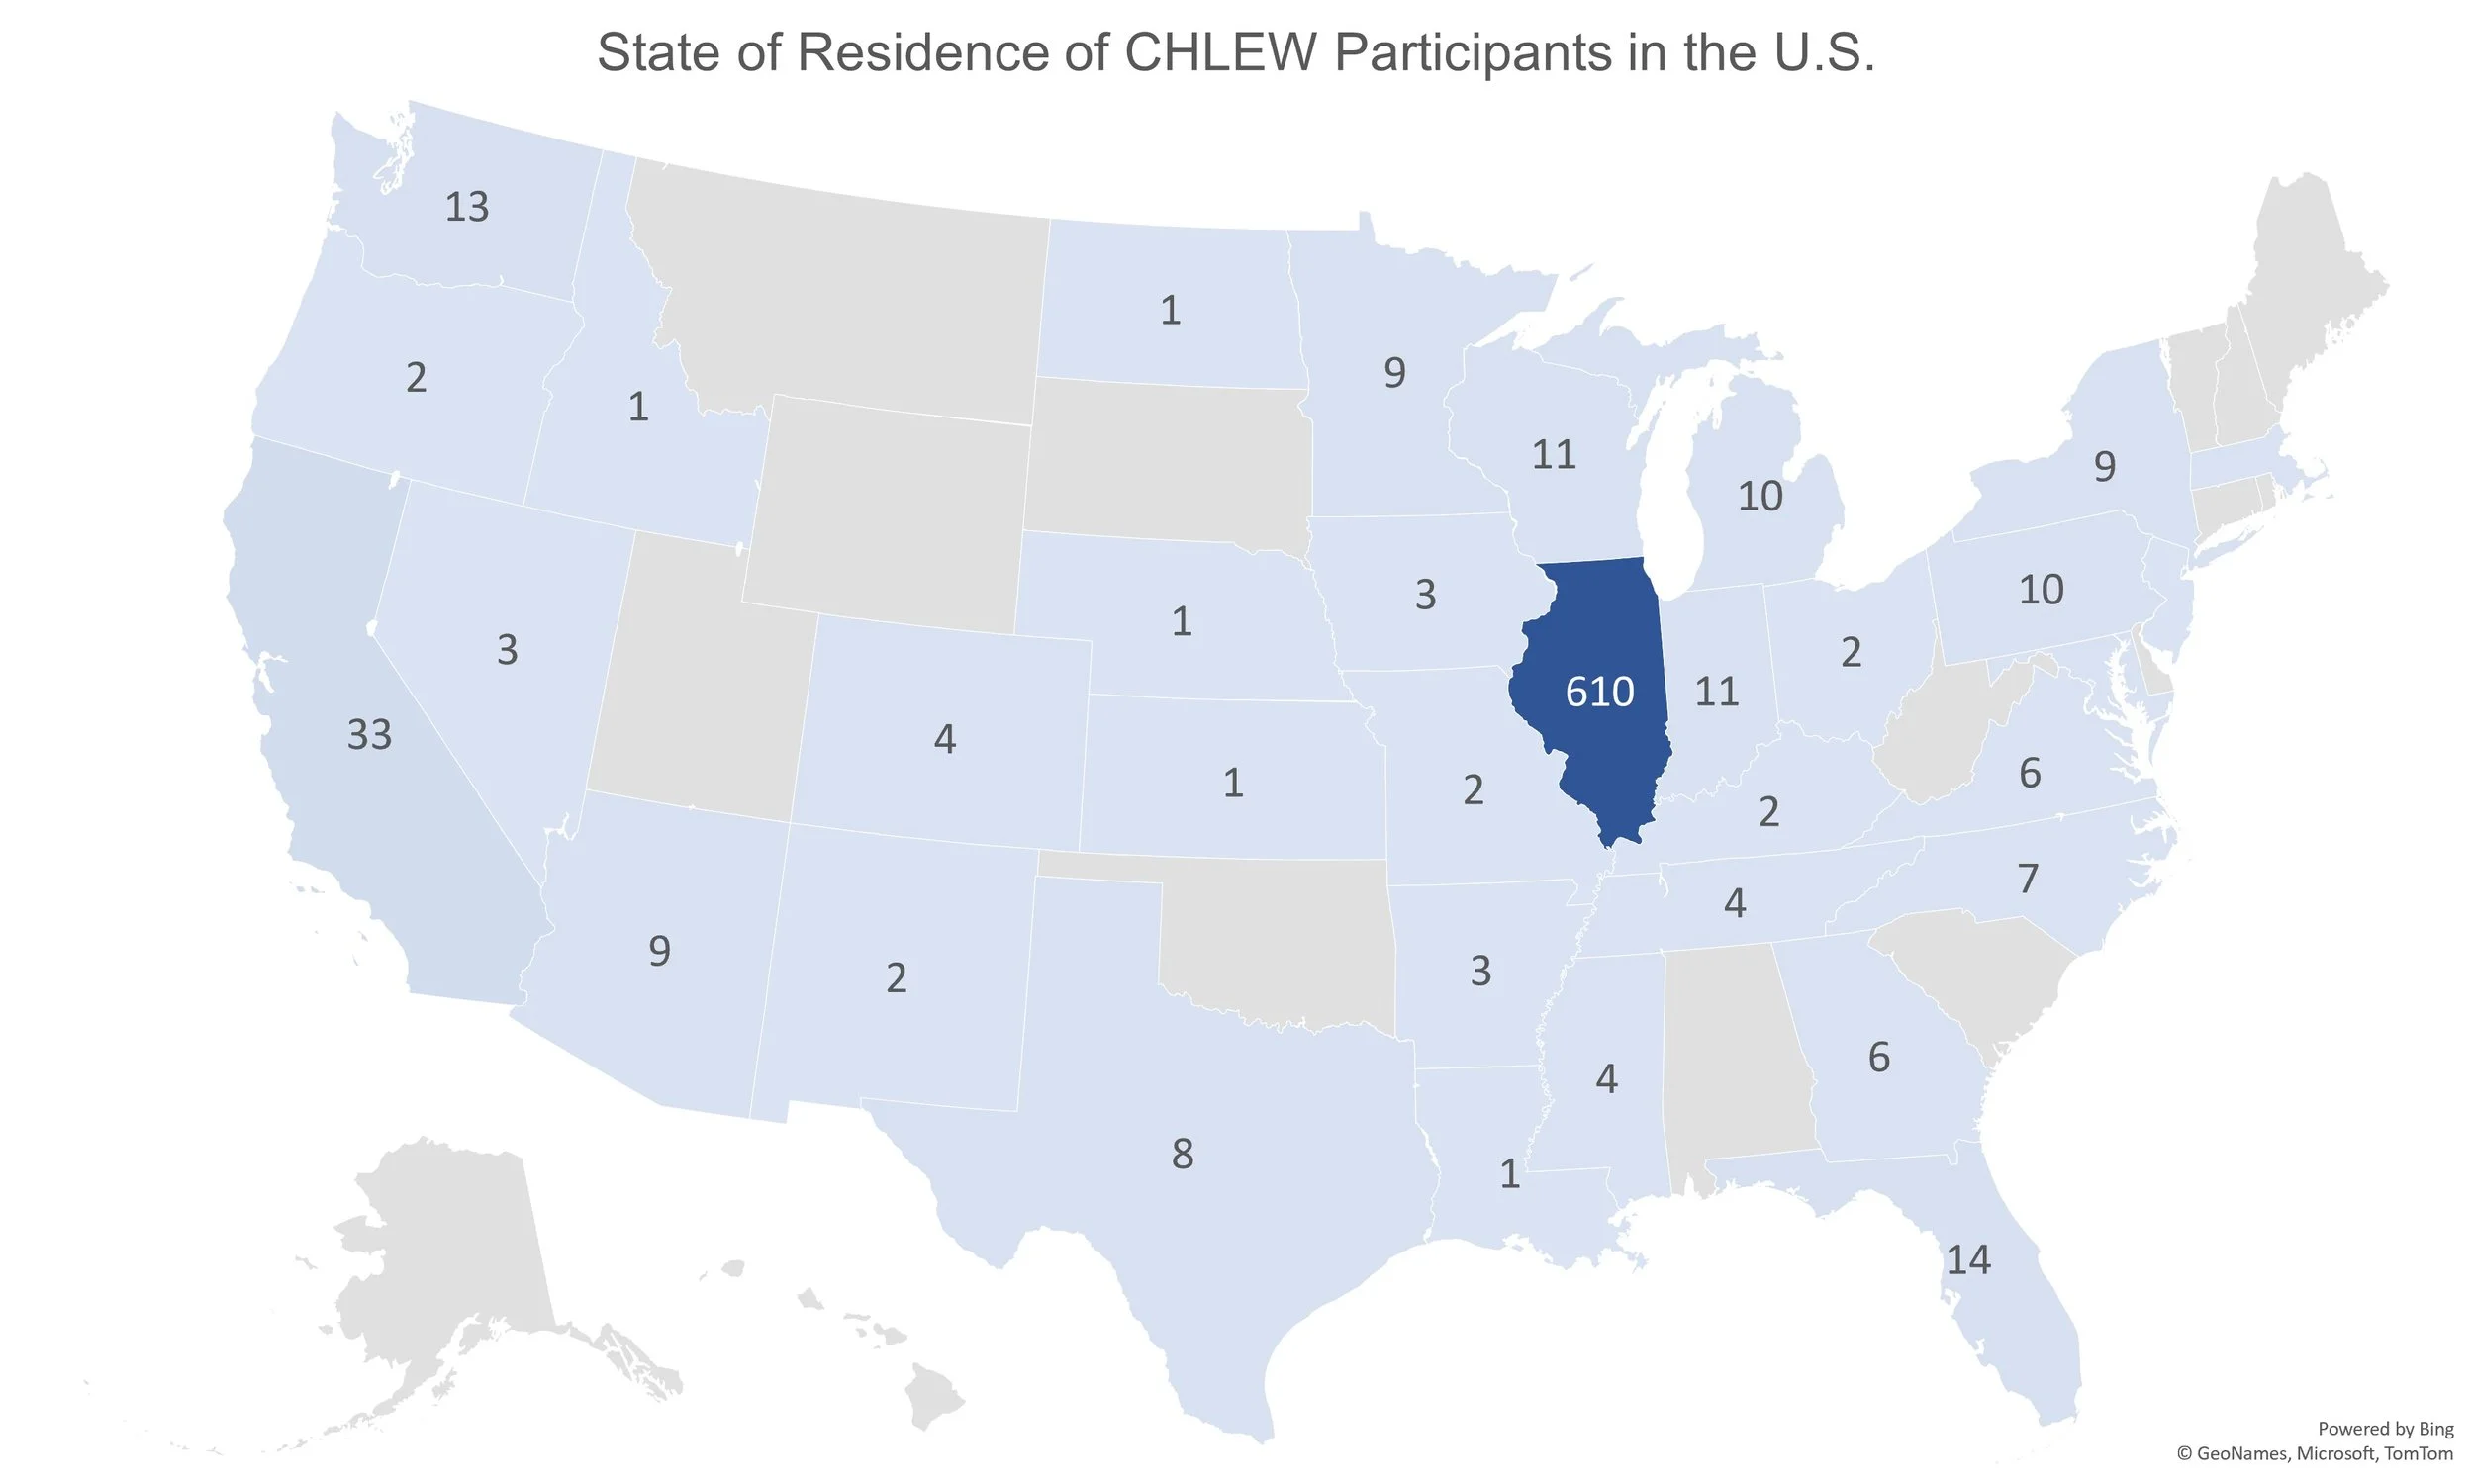
As of December 2021, the majority of CHLEW participants still live in Illinois, although other popular states include California, Indiana, and Washington. We also have participants living in Mexico, Canada and in the UK, Australia, and South Korea.
CHLEW participant age

The above chart shows the average and most common ages of participants in each wave of interviews. While it appears that CHLEW participants are getting younger over time, the decrease in average and most common age is actually due to the addition to a new group of participants, including those ages 18-24, in 2010-2012!

Sexual and gender identity

Most CHLEW participants identified as lesbian or mostly lesbian in the fourth round of interviews in 2017-2019. We also have many bisexual participants. Fewer participants identified as heterosexual, asexual, queer, pansexual, or other sexual identities.
Gender identity among participants has also changed over time. In the fourth round of interviews (2017 to 2019), nearly all (95%) of our participants identified as women; a few identified as male, nonbinary, gender queer, or ‘another gender’.
Race and ethnicity

In 2017-2019, most CHLEW participants were people of color. 41.1% of participants were White, with Black and Hispanic participants being the second and third largest groups.
Relationship status

About half of CHLEW participants were in committed relationships and living with a partner in 2017-2019, and about 13% were in committed relationships but not living with their partner. About a third were not in a relationship, 3.8% were separated, and 1.1% reported that their partners had died.
Of those in committed relationships, about half (46.4%) are legally married and 9% are in a civil union. Of those not in a committed relationship, 27% were dating at the time of their interview.
Outness to family members

In round four interviews (2017-2019), most of our CHLEW participants were out (disclosed that they had an LGBQ+ identity) to family members.
Spirituality
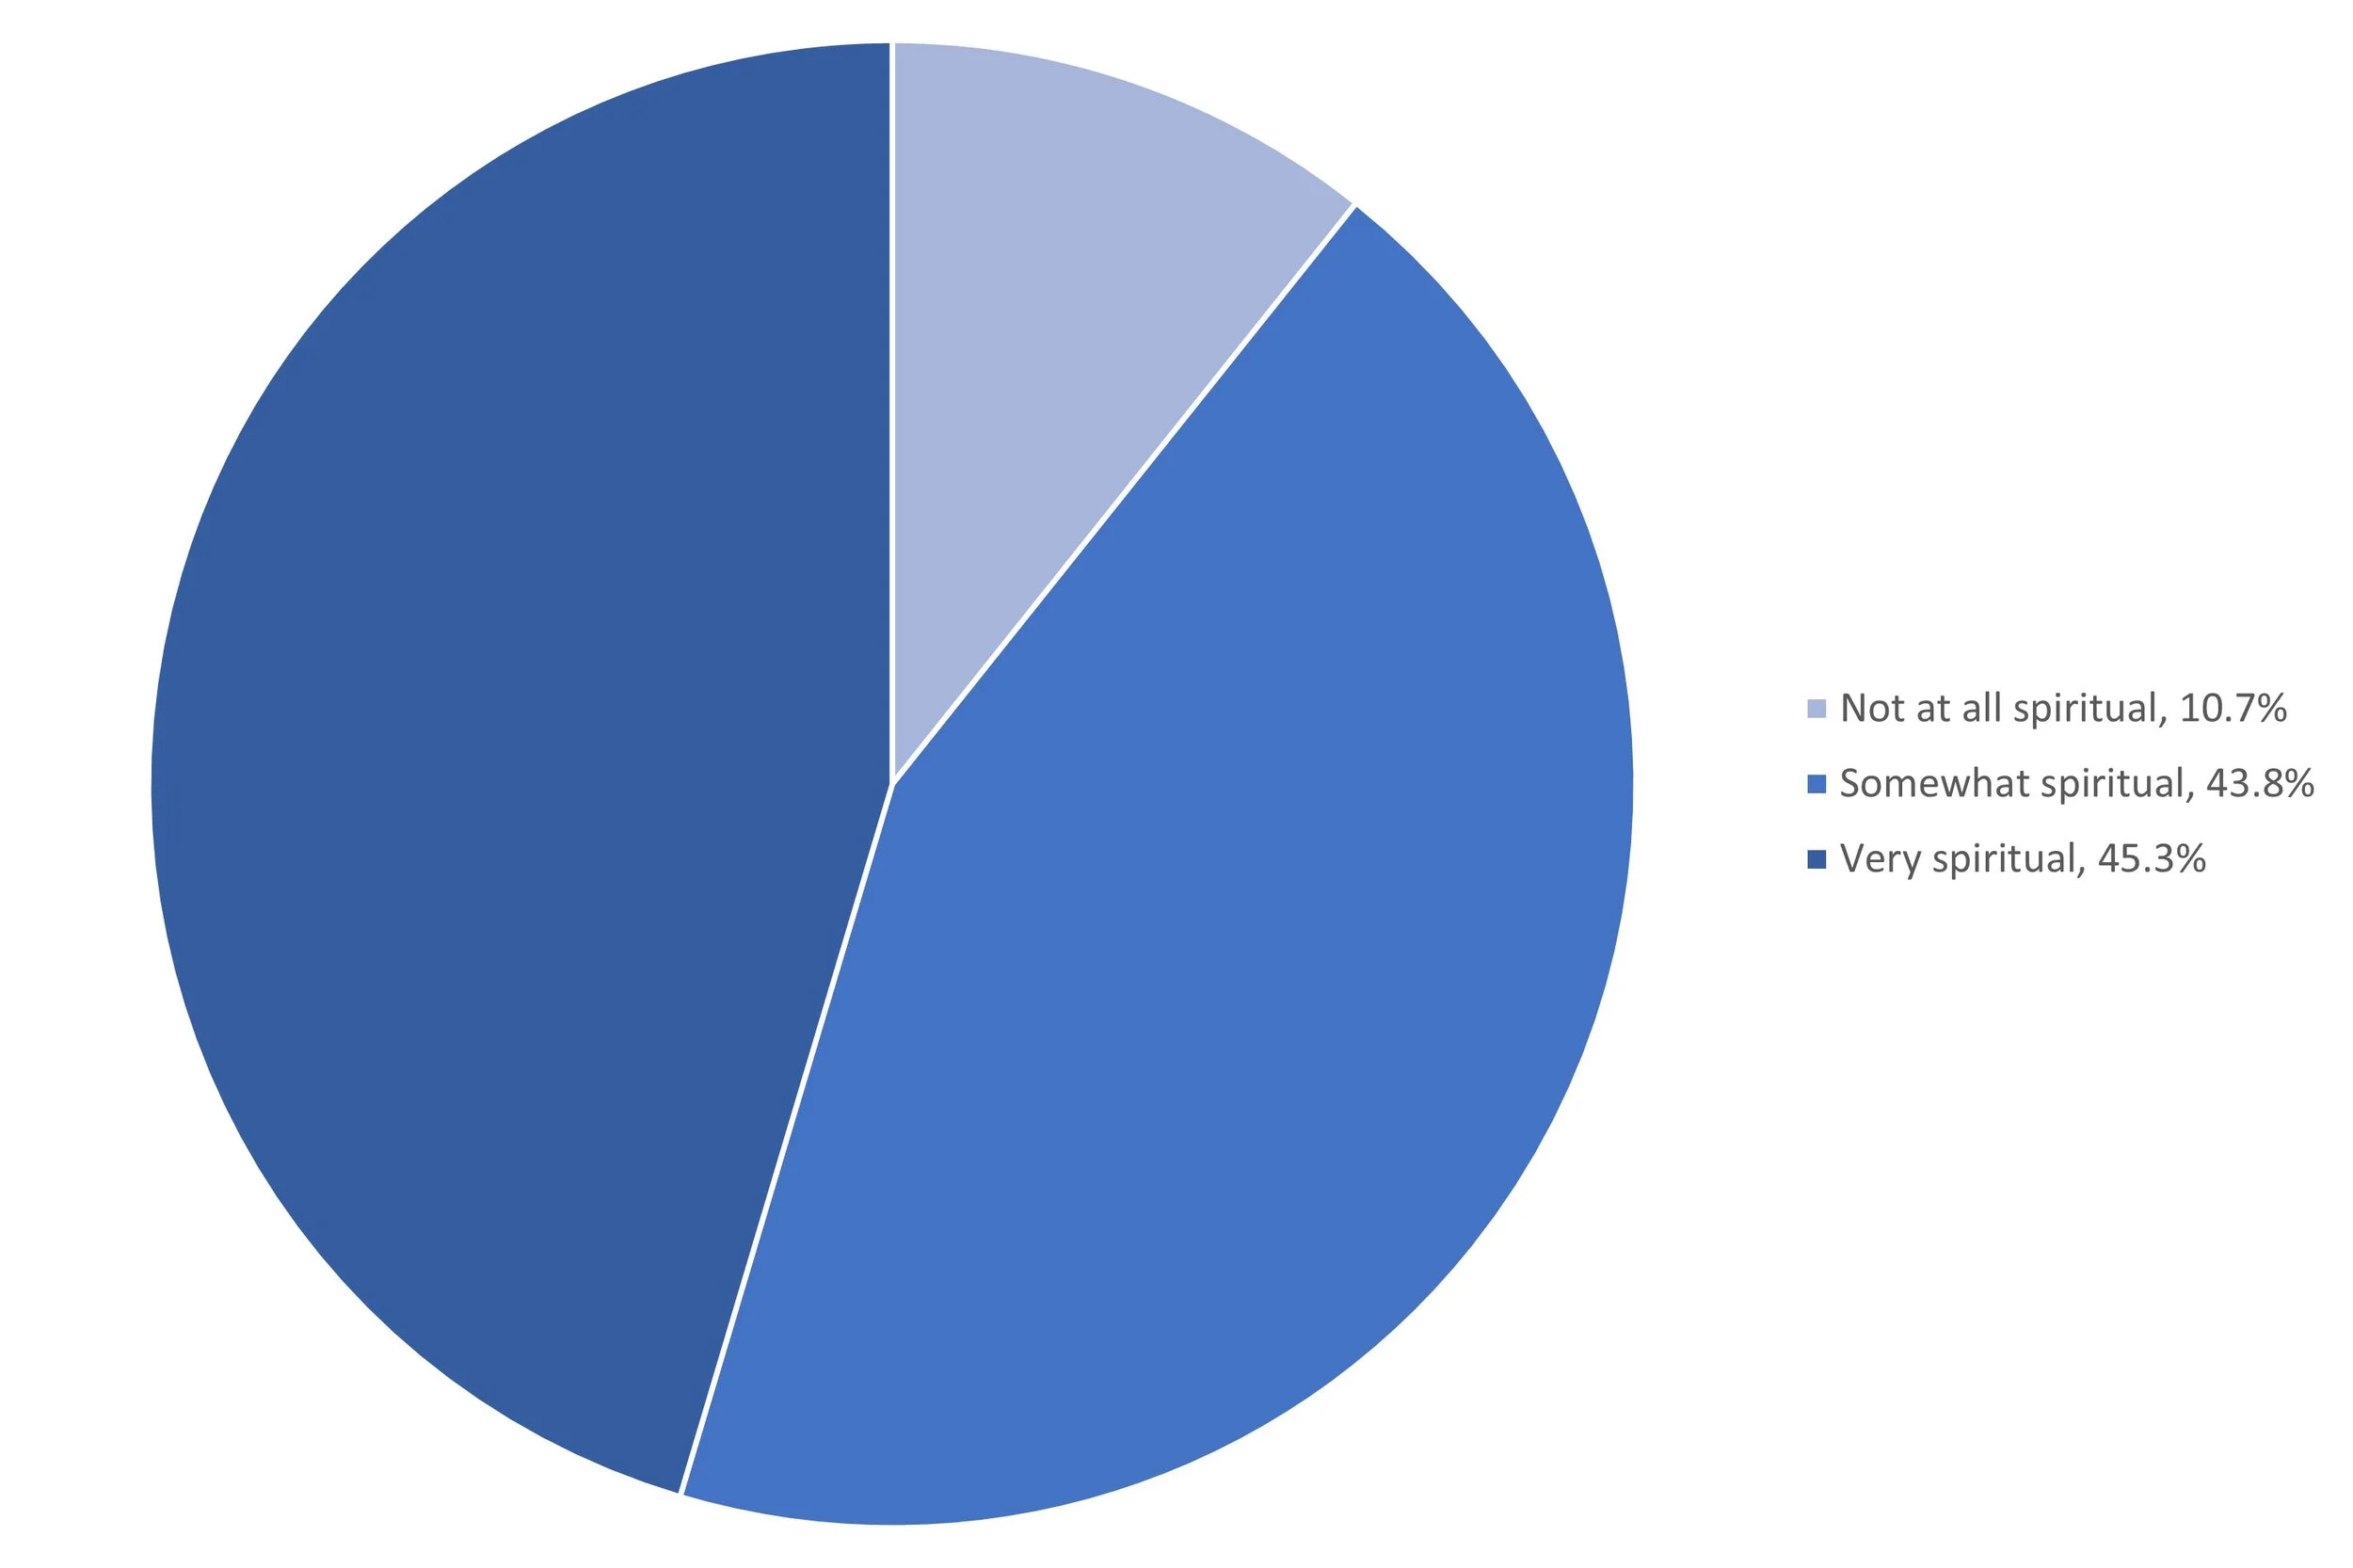
Also in round four, nearly 90% of CHLEW participants described themselves as somewhat or very spiritual.
In terms of religion, 26.1% of participants identified as Protestant, 7.6% as Catholic, 4.6% as Jewish, and 2.9% as Buddhist. 6.5% chose another religion, and 6.5% indicated no religious affiliation.
Income

In 2017-2019, roughly one third of CHLEW participants considered their income not enough to meet basic needs. Another third considered it enough to meet their needs and the final third considered their income more than enough to meet their basic needs.